
News and Events
Jun 01 2016Maps of FAPAR per crop type available over South-West area
The classification map of the South-West area has been set-up using a random forest classifier trained using as input in-situ observation and the Landsat-8 time series of surface reflectance covering the period February-November 2014. It results a land cover map discriminating 7 various crops (sunflower, sorgum, soybean, barley, corn, rapeseed, wheat) and grassland. This map is overlapped to high resolution FAPAR maps and average FAPAR is calculated per each crop. These maps are now available on the ImagineS ftp: you can get the access information after registration.
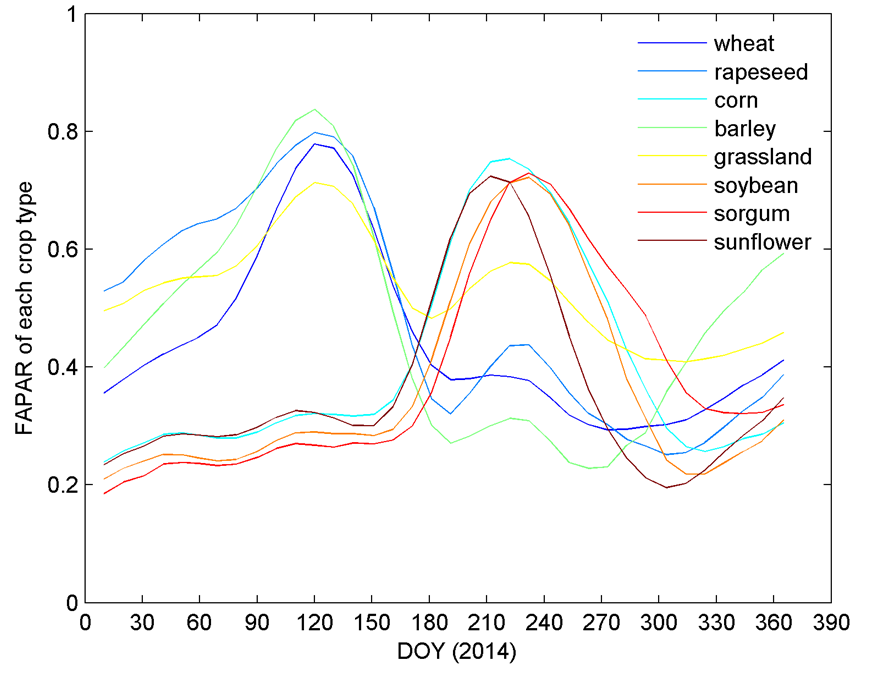
Seasonal variations of FAPAR per crop over Sout-West area in 2014
Back to Overview